Like the number of sunspots, the occurrence of solar flares follows the solar cycle of approximately 11 years.
But as the current Solar cycle 25 is approaching its peak, what is the number solar flares compared to the previous, smaller solar cycle 24?
Due to a change in flare calibration levels starting in 2020, you will find two answers to this question online, but only one is correct.
Related: The sun’s magnetic field is about to flip. Here’s what to expect.
The sun follows an 11-year solar cycle of increasing and decreasing activity. The solar cycle is usually measured by the number of sunspots visible on the sunwith data going back over 270 years. Most solar flares come from sunspots, so with more sunspots — you get more flare-ups.
Solar flares are categorized into flare classes, classified based on the size of soft X-rays observed in a narrow wavelength range of 0.1-0.8 nm. The flare classes are C-class, M-class, and X-class, each 10 times more powerful than the previous one. (Flare levels are then subdivided into a number, e.g. M2, X1, etc.). Flares in these categories (except for the very largest of the X-class events) tend to closely follow the solar cycle.
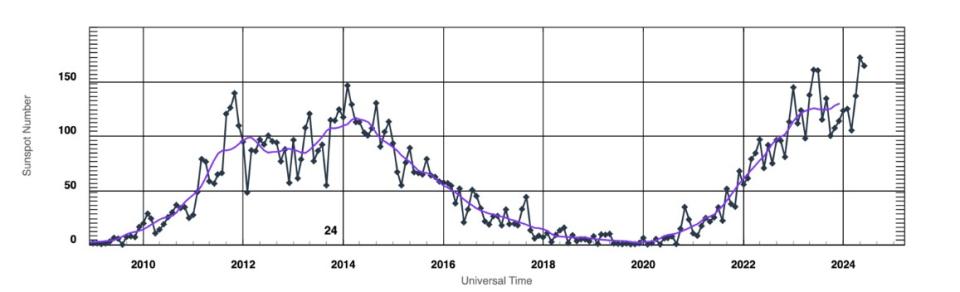
In terms of sunspot numbers, Solar Cycle 25 (our current cycle) has surpassed the sunspot levels of Solar Cycle 24 (which peaked in 2014). With higher sunspot numbers, we would also expect higher solar flare numbers. This is the case, but the difference is far from what some would have you believe.
Recalibrating solar flare levels
How do solar flares compare between solar cycles 24 and 25? It seems like a simple question, but it’s clouded by a 2020 recalibration of solar flare levels by the National Oceanic and Atmospheric Administration (NOAA).
X-ray radiation levels from solar flares have been measured since 1974. X-rays do not penetrate the earth’s atmosphereand can therefore only be measured by detectors on orbiting satellites. For the past 50 years, these solar flare detectors have been placed on NOAA’s GOES satellites. As technology improves and older technology deteriorates, newer detectors are launched on newer GOES satellites to keep the continuous observation of solar flares going. GOES-18 (the 18th satellite in the series) is the current satellite responsible for primary X-ray observations, with launched in 2022.
Because the flame levels are measured (and their classes defined) by detectors from multiple satellites/instruments, corrections are sometimes necessary to account for small differences in calibration between detectors.
From 2010-2020, flare levels were defined by GOES-14 and GOES-15 measurements. This period included the solar maximum period of solar cycle 24, until the end of that cycle. However, during the launch of these two satellites, a calibration discrepancy was discovered between GOES-14/15 and all previous GOES X-ray detectors. To fix this, science data from 1974-2010 (from GOES-1 to GOES-13 satellites) were all recalibrated to meet the new calibration, which was thought to be correct at the time. One result of this was that the threshold for each flare class increased by 42%, meaning that an individual 2010 flare would have to be 42% larger than a 2009 flare to get the same X-class level.
But, and here’s the twist: after switching to GOES-16 data on a new detector, it was discovered that the original calibration (from 1974-2010) had been correct all along, and the 2010-2020 calibration was the wrong one. This meant that in 2020, all previous data (from 1974-2020) were recalibrated to their previous correct levels, lowering the threshold of various flare classes). With a lower flare threshold, this meant that strong C-class flares (C7+) became M-class events, and strong M-class flares (M7+) became X-class flares. An X-class flare was therefore much easier to achieve in 2021 than in 2019. This 2020 recalibration therefore increased the number of higher-class flares in Solar Cycle 24 than initially reported.
A discrepancy in the number of flares
Following the 2020 recalibration of solar flare levels, NOAA has re-released their historical scientific flare datasets with the correct levels. However, the archived operational data, which lists the solar flare levels as they were originally reported, have not been recalibrated. As a result, various flare lists compiled and analyzed by third parties may use either the recalibrated scientific data or non-recalibrated operational data when comparing solar flare levels between solar cycles. The former comparison yields correct results, while the latter compares current Cycle 25 flare levels to severely underestimated flare levels from previous cycles, yielding scientifically incorrect comparisons. Let’s compare some data!
Comparison of Solar Cycle 24 and Solar Cycle 25
The graphs below show the number of solar flares occurring within each flare class, comparing solar cycles 24 and 25. The blue, orange, and red lines show the number of C-, M-, and X-class flares, respectively, multiplied by 0.1, 1, and 10 to plot the data on the same axis.
The thicker lines show these data for solar cycle 25 (with years since 2021 on the x-axis). The thinner, less saturated lines show the same data for solar cycle 24 (plotted against years since 2010).
The first graph shows this comparison based on historical flare operation data, so without taking into account the 2020 recalibration.
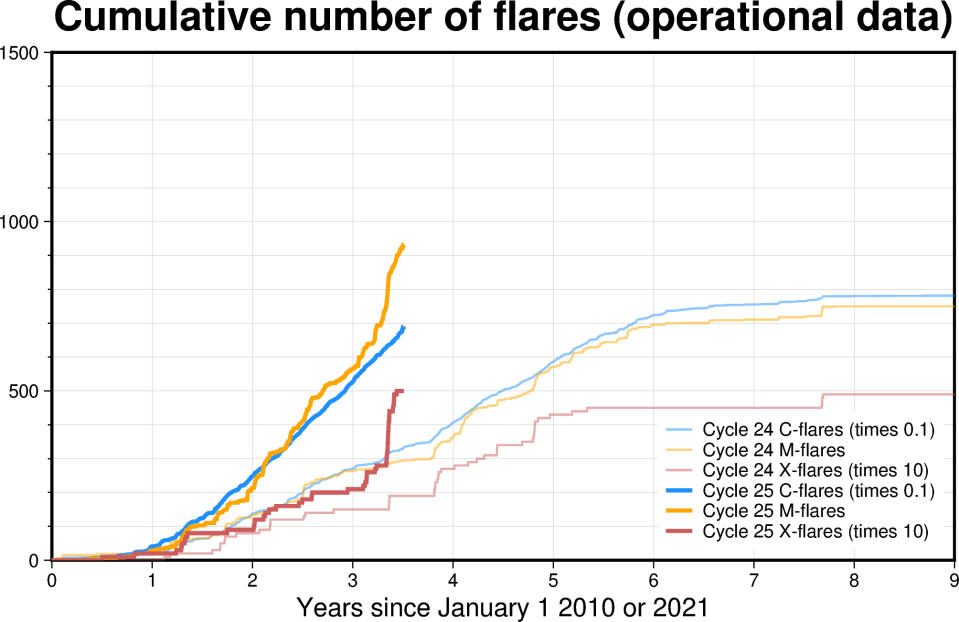
This graph shows a huge difference in the flare levels from cycle 24 to 25. According to this graph, the total number of M and X class flares in cycle 25 already overtaken Cycle 24’s total flare numbers, in less than half the time. This is a catchy headline, and was posted by several prominent social media accounts. But as catchy as that statistic sounds, it is incorrect. As we discussed, this chart does not account for the 42% recalibration of flare levels.
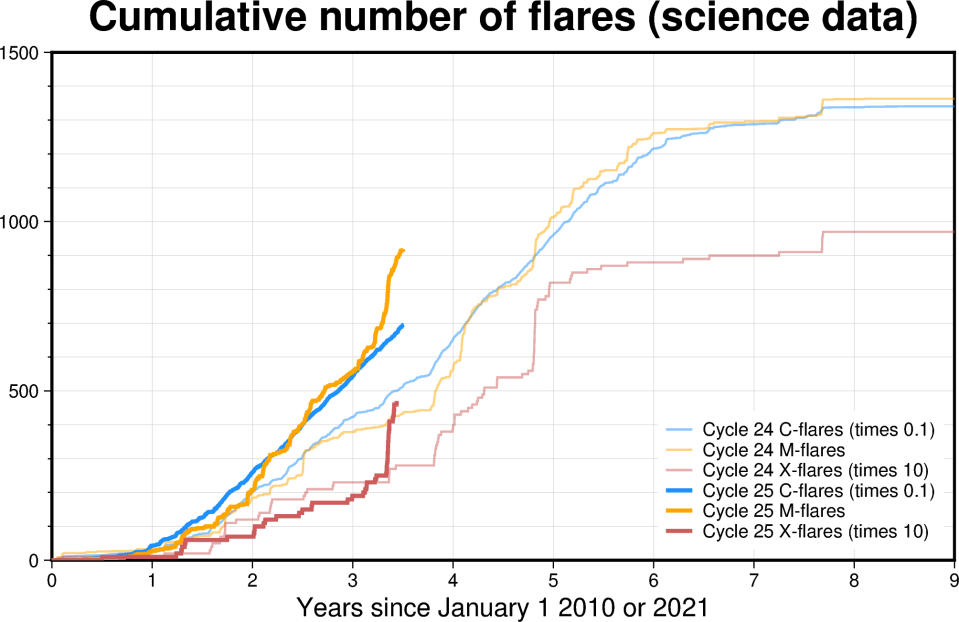
This second graph shows the same comparison, this time based on precise scientific data.
Related Stories:
—Solar flare triggers strongest radiation storm since 2017
—Solar storm bathes Mars in radiation as aurora flashes in Red Planet’s sky (video)
—Astrophotographer captures stunningly detailed images of our ‘fuzzy’ Sun
This graph shows the correct comparison of solar flares between Cycles 24 and 25. As you can see, while the number of Cycle 25 flares is still higher than that of Cycle 24 at every flare level, the discrepancy is much smaller than in the previous graph. The operational data underestimates the number of Cycle 24 flares by almost half, a significant discrepancy. In reality, the number of class X flares in Cycle 24 is only half of the total number of Cycle 24, and there were actually fewer class X flares until the recent solar activity of the famous active regions AR 13663 and AR 13664. This graph also shows that while there was a lot of class X activity in these active regions in May 2024, this level of activity is not unprecedented — with solar Cycle 24 experiencing a similar jump in flares toward the end of 2015.
So keep in mind that if you see a comparison of solar flare levels over the solar cycle online, check to see if it uses historical operational data (incorrect) or calibrated scientific data (correct).